10. Data Logging with MQTT, Node-RED, InfluxDB and Grafana
This tutorial will show you how to set up a local data logging application using an MQTT broker, Node-RED, InfluxDB, Grafana, and the Arduino® Portenta X8.
Overview
This tutorial will set up a typical Internet of Things (IoT) application: an MQTT data logger. For this application, we are going to use what we call in the Arduino team the "IoT-Quartet", four common building blocks that are popular and regularly used in these types of applications:
These four blocks will be running locally on the Arduino® Portenta X8 board. We will use data from an Arduino® MKR WiFi 1010 board to test the data logging application.
Goals
- Install, configure, and run Mosquitto (MQTT broker) locally in the Portenta X8
- Install, configure, and run Node-RED locally in the Portenta X8
- Install, configure, and run InfluxDB locally in the Portenta X8
- Install, configure, and run Grafana locally in the Portenta X8
- Send data from an Arduino® MKR WiFi 1010 board to the data logging application running locally in the Portenta X8
Required Hardware and Software
- Arduino® Portenta X8
- Arduino® MKR WiFi 1010
- USB-C® cable (either USB-C® to USB-A or USB-C® to USB-C®)
- Wi-Fi® Access Point (AP) with Internet access
- ADB or SSH
- Command-line interface
- Arduino IDE 2
If you are new to the Portenta X8 board, check out this User Manual on controlling your board using a terminal or command-line interface.
IoT Architecture Basics
IoT applications and devices are everywhere nowadays, even in places where we don't realize a device or application is connected to the Internet. Rather than a single technology, IoT is a concept that refers to the connection of everyday devices, just like your watch, to the Internet and how that Internet connection creates more and different ways to interact with your device and your environment. Interactions between humans and devices or applications create data (often in large quantities) that must be communicated and processed.
How can we plan, build and deploy IoT solutions? To answer that question, we must consider IoT architecture. Due to the variety of IoT devices and applications that exist and can be developed, there is no single, unique architecture for IoT devices and applications. However, we can discuss a foundational architecture that can be considered a starting point for any IoT project. This foundational architecture consists of three essential layers: perception (or devices), network, and application. Let's explore these layers in more detail:
- Perception layer: This is the sensor's layer, where data originates. In this layer, data is gathered by one or more sensor nodes. Actuators, which respond to data collected from sensor nodes, are also part of this layer.
- Network layer: This layer is responsible for collecting and transmitting data from sensor nodes to back-end services, such as databases. Data transmission can occur through various communication networks like Wi-Fi or cellular networks.
- Application layer: This layer is what the device or application user sees and interacts with, such as a dashboard. The sensor data is processed and displayed to the end-user in a user-friendly manner through smartphone apps or web interfaces.
These three layers are interconnected to form a complete IoT system. In this tutorial, we are going to take this base architecture and set up a data-logging application, as shown in the image below:
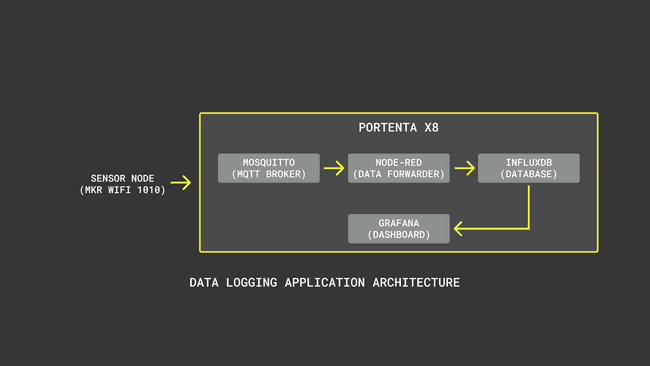
In the high-level architecture described in the image above:
- The perception layer consists of an MKR WiFi 1010 board; this board will gather information from a sensor.
- The network layer consists of the MQTT broker (Mosquitto), the data forwarder (Node-RED), and the database (InfluxDB).
- The application layer consists of a dashboard (Grafana), where information from the sensor node is shown.
For documentation purposes, we will explain, step by step, the installation process of each part of the application (Mosquitto, Node-RED, InfluxDB, and Grafana); this process can be done quickly using a unique Compose
file.YAML
Let's start by configuring the MQTT broker!
Installing Mosquitto
Let's start by creating a new directory in our Portenta X8
homemqttdocker-compose.yml1mkdir mqtt1cd mqtt1export TERM=xterm1stty rows 36 cols 1501sudo vi docker-compose.ymlThe
and export TERM=xterm
commands enable VI editor full screen.stty rows 36 cols 150
Inside the VI editor, copy and paste the following:
1services:2 mqtt:3 container_name: mosquitto4 image: eclipse-mosquitto5 restart: always6 user: "0:0"7 ports:8 - "1883:1883"9 - "9001:9001"10 volumes:11 - /var/rootdirs/home/fio/mqtt/config:/mosquitto/config:rw12 - /var/rootdirs/home/fio/mqtt/data:/mosquitto/data13 - /var/rootdirs/home/fio/mqtt/log:/mosquitto/log14volumes:15 config:16 data:17 log:
is a standard MQTT port; the 1883
port is usually used for TLS-secured MQTT connections.8883
Save the file and exit the VI editor. Return to the
mqtt1docker-compose up -dThe Mosquitto broker should be available on your Portenta X8
IP addressIP Addressping <hostname>We should see inside the
mqttconfigdatalogdocker-compose.ymldocker-compose up -dconfig1sudo wget https://raw.githubusercontent.com/eclipse/mosquitto/master/mosquitto.confLet's add the following lines at the end of the
config1# Listen on port 1883 2listener 18833listener 90014
5# Save the in-memory database to disk6persistence true7persistence_location /mosquitto/data/8
9# Log to stderr and logfile10log_dest stderr11log_dest file /mosquitto/log/mosquitto.logSave the file and exit the VI editor. Now, let's restart the Mosquitto container so the configuration file can start working. This can be done using the
docker restartCONTAINER IDCONTAINER IDdocker psCONTAINER ID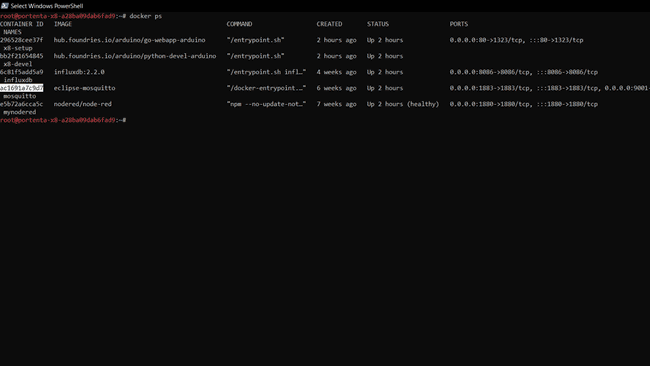
Now, we need to manage password files by adding a user to a new password file. For this, we need to run the
shCONTAINER ID1docker exec -it CONTAINER ID shLet's dissect that command:
runs a command in a running container (in this case, the Mosquitto container)docker exec
attaches a terminal session into the running container so we can see what is going on with the container and interact with it-it CONTAINER ID sh
Now, in the terminal session with the Mosquitto container, run the following command:
1mosquitto_passwd -c /mosquitto/config/mosquitto.passwd guestThis command creates a new password file (
mosquitto.passwdguestusernameexitconfigmosquitto.passwdmosquitto.config1password_file /mosquitto/config/mosquitto.passwd2allow_anonymous trueThe file should see now like this:
1# Password file2password_file /mosquitto/config/mosquitto.passwd3allow_anonymous true4
5# Listen on port 1883 6listener 18837listener 90018
9# Save the in-memory database to disk10persistence true11persistence_location /mosquitto/data/12
13# Log to stderr and logfile14log_dest stderr15log_dest file /mosquitto/log/mosquitto.logTo test it, save the file and exit the VI editor; also, we need to restart the Mosquitto container so the configuration file can start working. This can be done by using the
docker restartCONTAINER IDTesting Mosquitto
To test the Mosquitto broker, we need an MQTT client. We can use several ways to implement an MQTT client, one of the easiest ways is to install an MQTT client in our web browser and use it to test the connection between the local MQTT broker on the Portenta X8 board and the web-based MQTT client. This tutorial will use MQTTBox, a Google Chrome extension that works as an MQTT client.
In MQTTBox, let's start by configuring the settings of the MQTT client. The information we are going to need is the following:
- MQTT client name: in this example, Portenta X8 MQTT Broker
- Protocol: mqtt/tcp
- Username: the one you defined previously in the tutorial
- Password: the one for the user you defined previously in the tutorial
- Host: This is your Portenta X8 board IP address
Leave everything else as default and save the settings of the client. If everything is ok, you should see now that the MQTT client connected with the local MQTT broker in our Portenta X8 board. Success! We can now start sending messages to the MQTT broker.
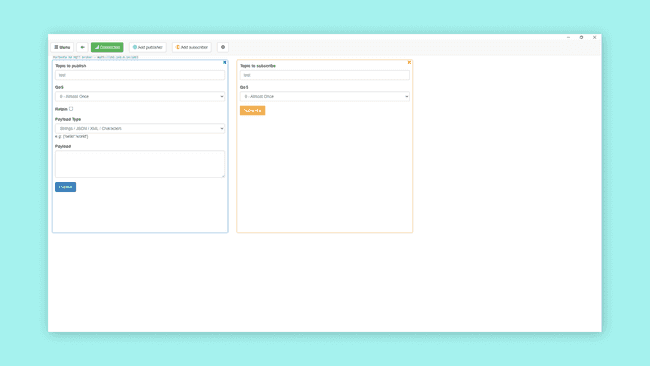
When MQTTBox client connects to the local Mosquitto broker deployed in our Portenta X8 board, a blue "Not Connected" button should change to a green "Connected" button; also, notice that with the MQTTBox client, we are going to publish data to the
testInstalling Node-RED
Node-RED is an open-source programming tool that connects hardware with API's and online services. It is a visual tool designed for Internet of Things devices and applications, but it can also be used for other applications. The simplest form to run Node-RED with Docker is by using the following command:
1docker run -it -p 1880:1880 -v node_red_data:/data --name mynodered nodered/node-redThis command will run a Node-RED container locally in our Portenta X8 board. Let's dissect the command:
: a terminal session is attached to the container so we can see what is happening with the container-it
: Node-RED local port-p 1880:1880
connects to the exposed internal port18801880
: a docker named volume calledv node_red_data:/data
is mounted to the containernode_red_data
directory. This permits any changes to the flow to persist/data
: a friendly local name--name mynodered
: the image to base it onnodered/node-red
After running the command, we should see a running instance of Node-RED in the terminal. The local instance of Node-RED should be ready; let's test it! We can detach the terminal with
Ctrl-pCtrl-qTesting Node-RED
Let's browse to
http://{your-portenta-ip}:1880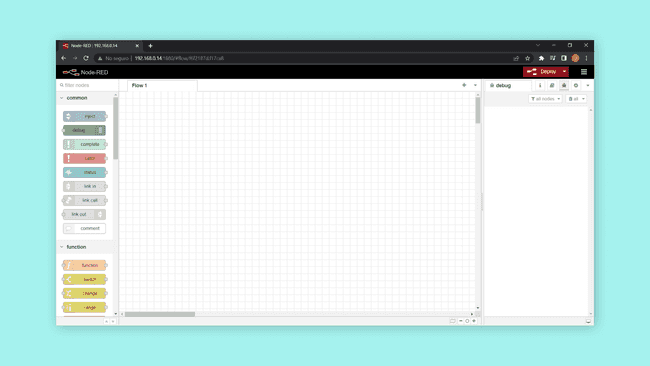
Node-RED desktop is a GUI that lets us work with Node-RED flows graphically. We can test Node-RED by connecting to the local MQTT broker we set up before using a Node-RED flow. In the
Nodesnetworkmqtt in- Server:
your-portenta-ip:1883 - Action:
Subscribe to the single topic - Topic:
test - QoS:
0 - Output:
auto-detect (string or buffer) - Name:
MQTT Broker X8
Now, search for the
change- Name:
String to Number - Set:
msg.payload - To the value:
$number(payload)
Now, let's search for the
debugtestdebug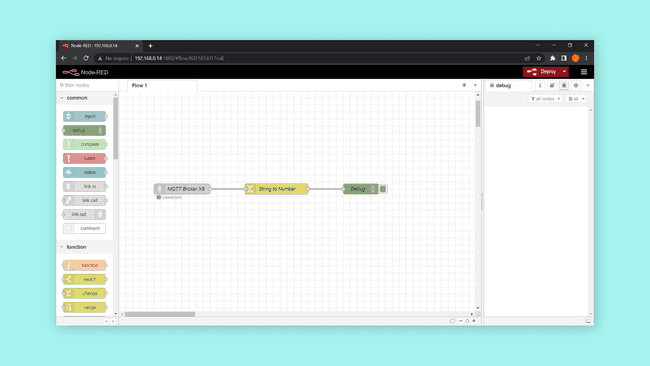
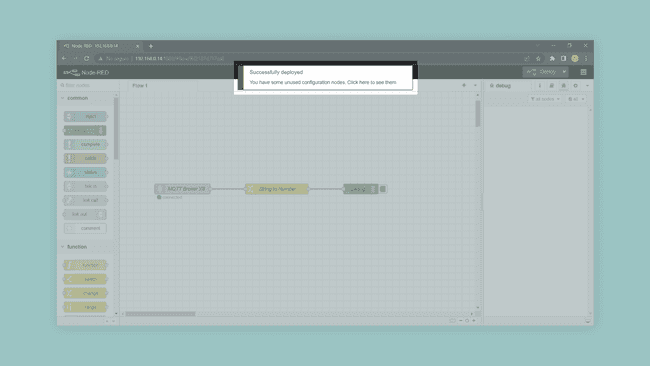
After connecting the nodes, we must deploy the Node-RED application by selecting the "Deploy" button on the browser's superior right side. We should see a "Successfully deployed" message if everything is ok, as shown in the image below:
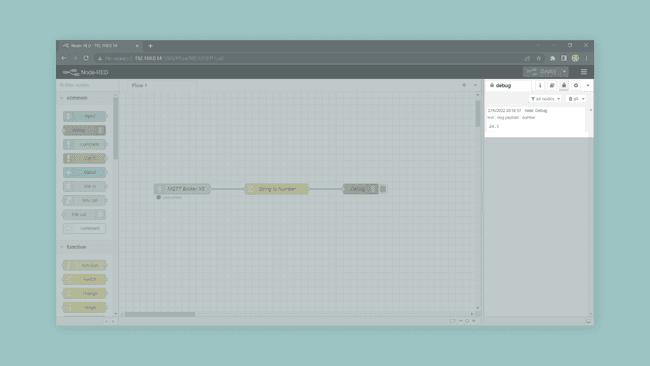
Let's use the MQTT client described before to test the MQTT broker integration with Node-RED. Just beneath the "Deploy" button, look for an icon with a bug; Node-RED's debug interface is open by clicking on the bug icon. Now we can start sending messages to the local MQTT broker in the X8 and see them deployed in the debug interface of Node-RED. With the MQTT client, let's subscribe first to the
test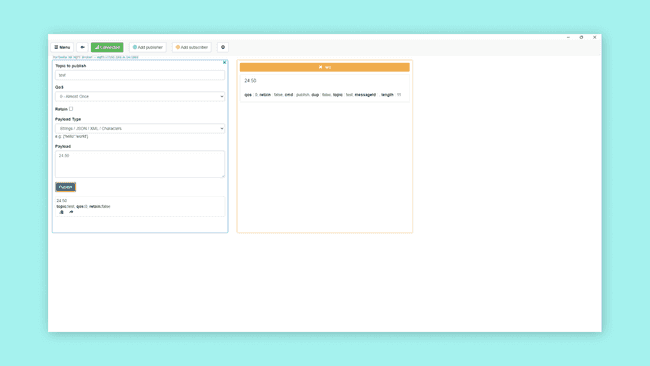
We should now see data in the debug interface of Node-RED, as shown in the image below:
We can now proceed to configure InfluxDB.
Installing InfluxDB
InfluxDB is an open-source, high-performance, time series database; with InfluxDB data can be written and read in real-time, and data can be processed in the background for extract, transform, and load (ETL) purposes or for monitoring and alerting purposes. User dashboards for visualizing and exploring data can also be set up.
The simplest form to run InfluxDB with Docker is by using the following command:
1docker run --detach --name influxdb -p 8086:8086 influxdb:2.2.0This command will run an InfluxDB container locally in our Portenta X8 board. Let's dissect the command:
: no terminal session is attached to the container--detach
: the container name--name
: InfluxDB local port-p 1880:1880
connects to the exposed internal port80868086
The container should now be running in the background; let's test the local instance of InfluxDB!
Testing InfluxDB
For testing the local instance of InfluxDB we are going to use its desktop and also Node-RED. Let's browse to
http://{your-portenta-ip}:8086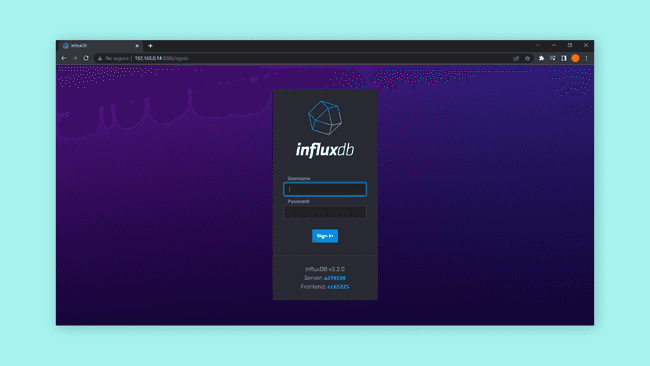
InfluxDB desktop is a GUI that lets us work with InfluxDB graphically.
The first time you enter the InfluxDB desktop, a username, and a password must be set up.
After setting up a username and a password, we are going to be redirected to the "Getting Started" page, as shown in the image below:
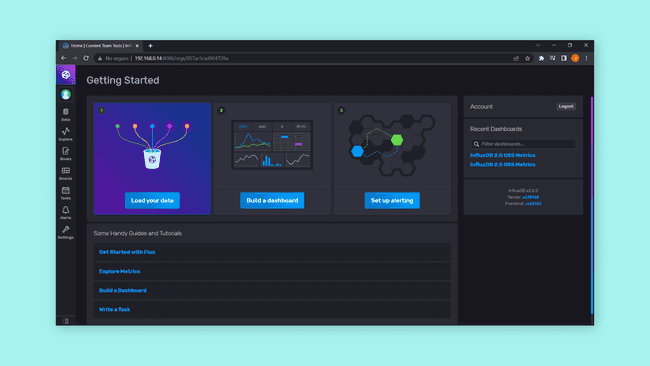
In this example, we will send data from the MQTT broker to InfluxDB using Node-RED; Node-RED will act as a bridge between the MQTT broker and InfluxDB. Let's go to "Data" we are going to be redirected to the "Load Data" page, as shown in the image below:
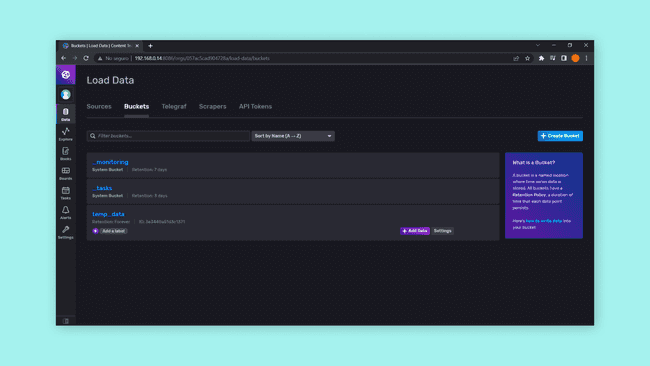
Select "Buckets" and click on the "Create Bucket" button. This will create a new database where data from the MQTT broker will be saved. For this example, let's create a new bucket called
test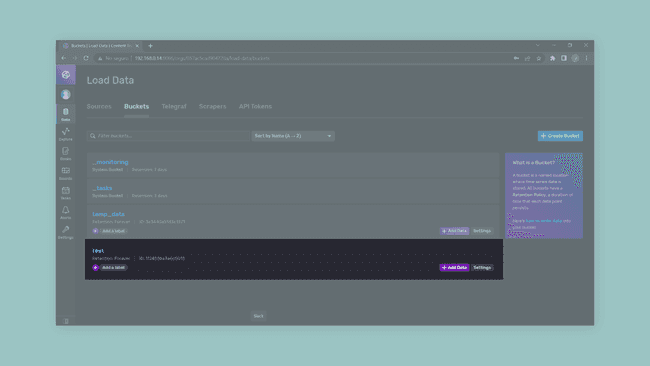
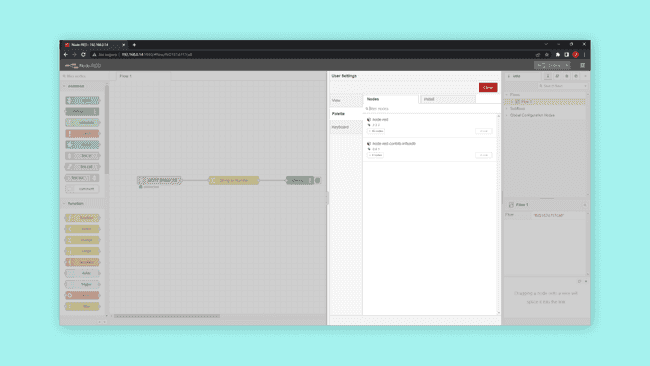
InfluxDB is now ready to receive data; let's send it using an MQTT client and Node-RED. We must first set up Node-RED by installing custom InfluxDB nodes; click on the menu icon on the top right corner of the browser, then click on the "Manage palette" option. This will open a tab where we can see all the palettes/nodes installed in the Node-RED instance running on our X8 board. Click on the "Install" option and search for "InfluxDB"; install the nodes from InfluxDB. Now we should see the InfluxDB nodes installed in our Node-RED instance, as shown in the image below:
Now, search for the
influxdb outtest- Name:
InfluxDB Bucket - Organization: Your organization name is defined in InfluxDB
- Bucket:
test - Measurement:
(the name of the measurement you want to record)counter - Time Precision: Milliseconds (ms)
In the Server option, define the following properties:
- Name:
Portenta X8 - Version:
2.0 - URL:
http://{your-portenta-ip}:8086 - Token: the one provided by InfluxDB
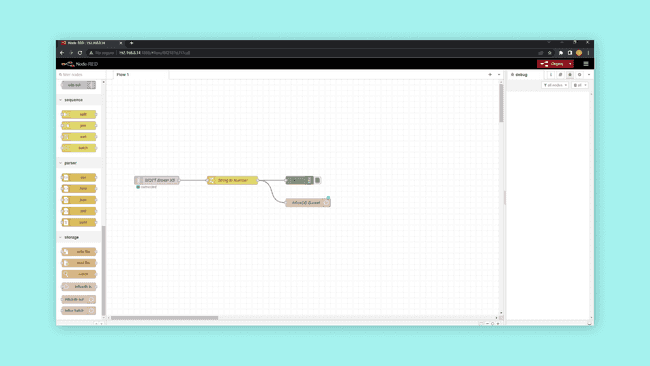
Now, connect the nodes as shown in the image below:
Let's use the MQTT client described before to test the MQTT broker integration with Node-RED and InfluxDB. Remember to first deploy the flow in Node-RED and subscribe to the
test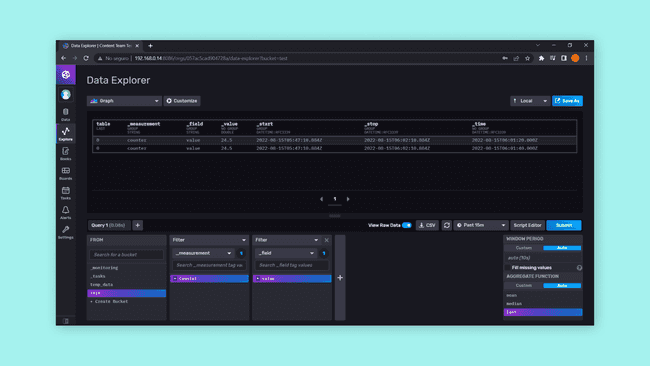
We can now proceed to configure Grafana.
Installing Grafana
Grafana is an open-source, multi-platform data analytics and interactive data visualization solution. Grafana can connect with basically every possible data source, such as InfluxDB.
The simplest form to run Grafana with Docker is by using the following command:
1docker run -d --name=grafana -p 3000:3000 grafana/grafanaThis command will run a Grafana container locally in our Portenta X8 board. Let's dissect the command:
: no terminal session is attached to the container-d
: the container name--name
: Grafana local port-p 3000:3000
connects to the exposed internal port30003000
The container should now be running in the background; let's test the local instance of Grafana!
Testing Grafana
Before we can visualize data in Grafana, we must add a data source; we will add the InfluxDB bucket we created before as a data source. Select the cog icon on the side menu and then click on "Data Sources":
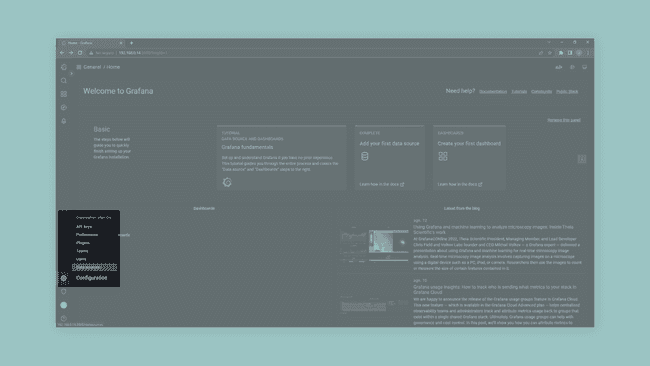
On the "Data Sources" page, select InfluxDB; this will take you to a configuration page:
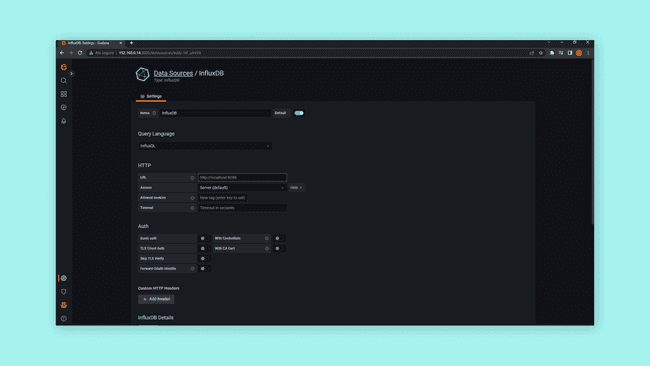
In the configuration page, enter the following information related to the data bucket we created before on InfluxDB:
- Name:
Test Bucket - Query Language: Flux
- URL:
http://{your-portenta-ip}:8086 - User: Your defined username in InfluxDB
- Password: Your defined username password in InfluxDB
- Organization: Your defined organization name in InfluxDB
- Token: the one provided by InfluxDB
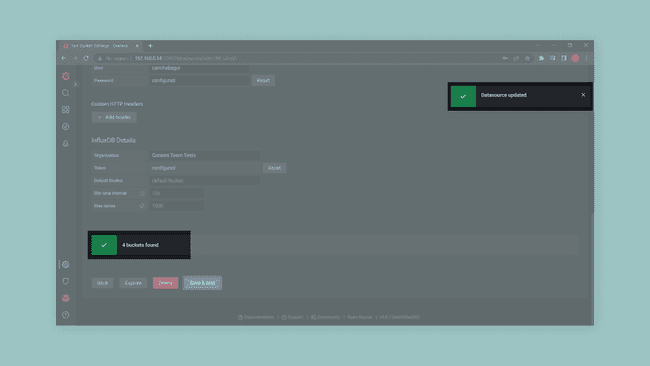
Leave the rest of the options as default. Click on the "Save & Test" button; we should see two green messages in the Grafana GUI telling us that the data source was configured correctly, as shown in the image below:
Now, let's go to the InfluxDB desktop. Go to "Data" and select the test bucket we created before; in the bucket data explorer, in the query editor, select the
test_measurement_fieldWINDOW PERIOD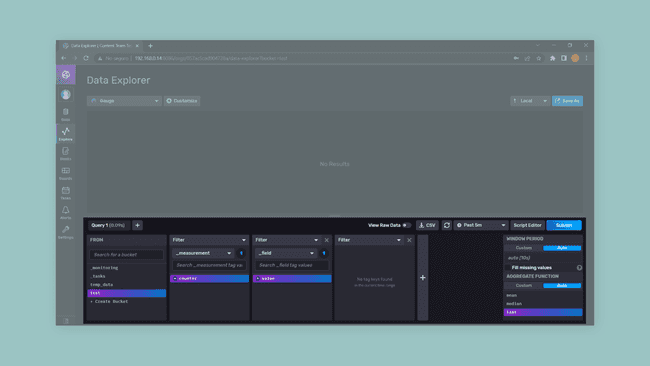
Now, click on "Script Editor" and copy the generated script by InfluxDB; we are going to use this script in Grafana to retrieve information from the
test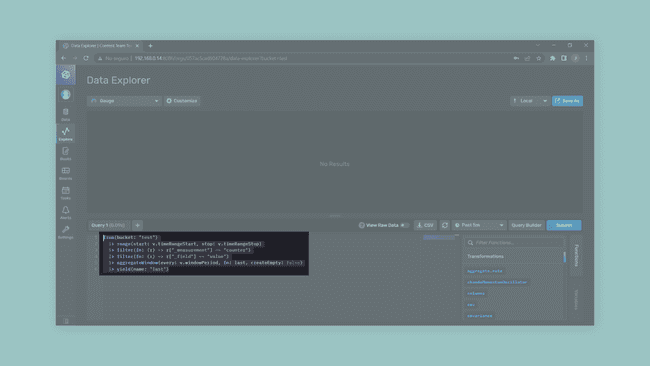
Now, in the Grafana GUI, create a new dashboard and add a new panel; in the configuration page, select as "Data source" the bucket we configured before,
Test Bucket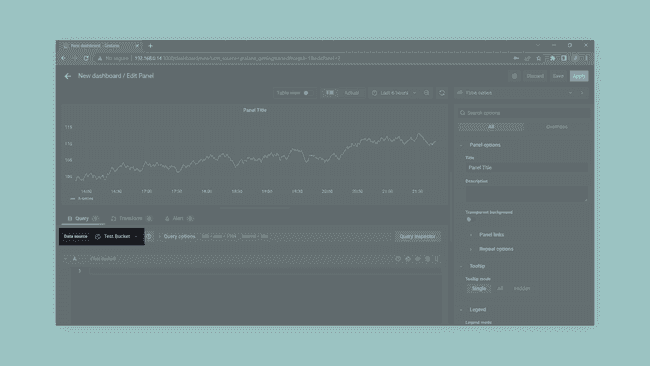
In the "Query inspector," paste the script we generated before with InfluxDB. You should now see data from the tests made earlier with the MQTT client:
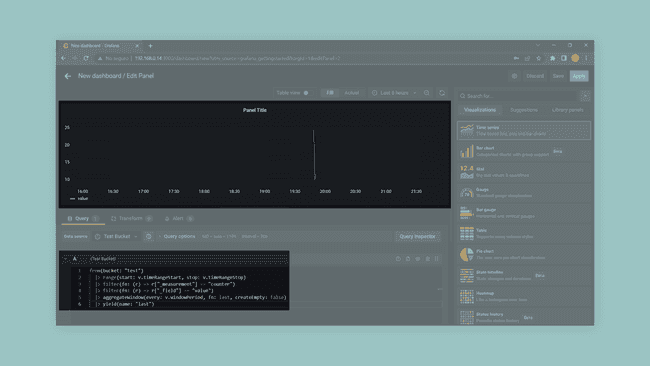
Let's change how data is visualized. Select "Visualizations" and then search for "Gauge" and select it. Now we should visualize data as a gauge in Grafana:
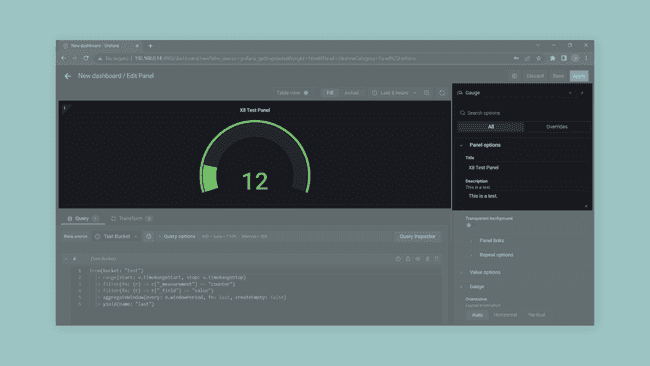
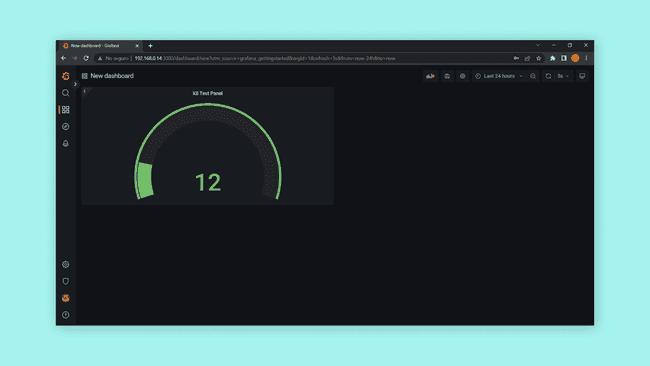
We can change the panel options, such as their title and description. Click on apply; we can now use the MQTT client described before to test the MQTT broker integration with Node-RED, InfluxDB, and Grafana. Remember first to deploy the flow in Node-RED, subscribe to the test topic, and publish any value in the MQTT client. Also, remember to change the dashboard time range and its refresh rate.
Sending Data Using the MKR WiFi 1010 Board
Now, it is time to test our entire data-logging application. We will use an MKR WiFi 1010; this board will periodically send the value of a counter to the Grafana dashboard via the local MQTT broker deployed in the X8.
First, let's ensure we have the required core for the MKR WiFi 1010 installed, the Arduino SAMD boards (32-bit Arm® Cortex®-M0+). Please, refer to this guide if you are not familiar with the installation of additional cores in the Arduino IDE. We also need to install the libraries we will use to send data from the MKR WiFi 1010 board to the data logging application via MQTT. Go to Tools > Manage libraries..., search for ArduinoMqttClient and WiFiNINA, and install the latest available version of both libraries.
Now, let's open a new sketch and create a new header file called
arduino_secrets.h1#define SECRET_SSID "your-ssid"2#define SECRET_PASS "your-password"Now, let's program the following sketch in the MKR WiFi 1010 board:
1#include <ArduinoMqttClient.h>2#include <WiFiNINA.h>3#include "arduino_secrets.h"4
5// Wi-Fi® information6char ssid[] = SECRET_SSID; // Your network SSID, stored in the arduino_secrets.h file7char pass[] = SECRET_PASS; // Your network password, stored in the arduino_secrets.h file8WiFiClient wifiClient;9MqttClient mqttClient(wifiClient);10
11// MQTT broker information12
13const char broker[] = "your-portenta-ip";14int port = 1883;15const char topic[] = "test";16
17// Interval for sending messages (in milliseconds) to the MQTT broker18const long interval = 5000;19unsigned long previousMillis = 0;20
21// Data to send to the MQTT broker22int count = 0;23
24void setup() {25 Serial.begin(9600);26 while (!Serial) {27 ; // Wait for serial port to connect, needed for native USB port only28 }29
30 // Attempt to connect to the defined Wi-Fi® network31 Serial.print("- Attempting to connect to WPA SSID: ");32 Serial.println(ssid);33
34 while (WiFi.begin(ssid, pass) != WL_CONNECTED) {35 // Connection attempt failed, retry again36 Serial.print(".");37 delay(5000);38 }39
40 Serial.println("- You're connected to the network!");41 Serial.println();42 43 // Attempt to connect to the defined Wi-Fi® network44 Serial.print("- Attempting to connect to the MQTT broker: ");45 Serial.println(broker);46
47 // Connection attempt to the MQTT broker failed48 if (!mqttClient.connect(broker, port)) {49 Serial.println("- MQTT connection failed!");50 Serial.print("- Error code: ");51 Serial.println(mqttClient.connectError());52
53 while (1);54 }55
56 Serial.println("- You're connected to the MQTT broker!");57 Serial.println();58}59
60void loop() {61 // Keep the board connected to the MQTT broker62 mqttClient.poll();63
64 unsigned long currentMillis = millis();65
66 if (currentMillis - previousMillis >= interval) {67 // Send the gathered data to an specific topic of the MQTT broker68 previousMillis = currentMillis;69 Serial.print("- Sending message to topic: ");70 Serial.println(topic);71 Serial.print("- ");72 Serial.println(count);73 mqttClient.beginMessage(topic);74 mqttClient.print(count);75 mqttClient.endMessage();76 Serial.println();77
78 // Update data value 79 count++;80 }81}The sketch shown above connects the MKR WiFi 1010 to the local MQTT broker of the X8 and periodically sends the value of a counter to the topic
testPlease read this tutorial for more in-depth information about MQTT and the MKR WiFi 1010 board.
If everything is ok, we should see the following in the Serial monitor of the Arduino IDE :
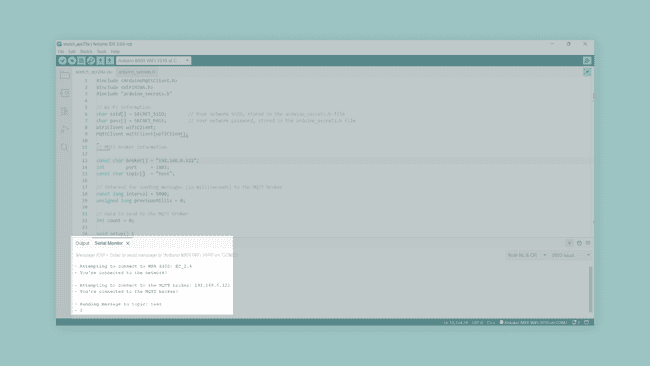
Check out now the Grafana dashboard we configured earlier; we should see data coming from the MKR WiFi 1010 board.
Conclusion
In this tutorial, we went through the installation, configuration, and testing of four standard building blocks of Internet-connected data-logging devices and applications. Such blocks are an MQTT broker (Mosquitto), Node-RED, InfluxDB, and Grafana. All this runs locally in the Portenta X8 board and can process data sent from an MKR WiFi 1010 board for a complete data-logging application. With this, we can further scale up your IoT development within a single Portenta X8 of the size of the palm of your hand.
Next Steps
- What about controlling your house or office and making it domotic?
- Do you have a sensor network that needs to be connected to the Internet to visualize sensor information?
You can use a Portenta X8 board and the IoT-Quartet tutorial for developing this and more projects.
Suggest changes
The content on docs.arduino.cc is facilitated through a public GitHub repository. If you see anything wrong, you can edit this page here.
License
The Arduino documentation is licensed under the Creative Commons Attribution-Share Alike 4.0 license.